

Candlestick Analysis Guide
Candlestick Chart Analysis
Candlestick charts are a powerful tool for understanding price movements and identifying potential trading opportunities. This guide will help you read and interpret candlestick patterns on Blanket's stock charts.
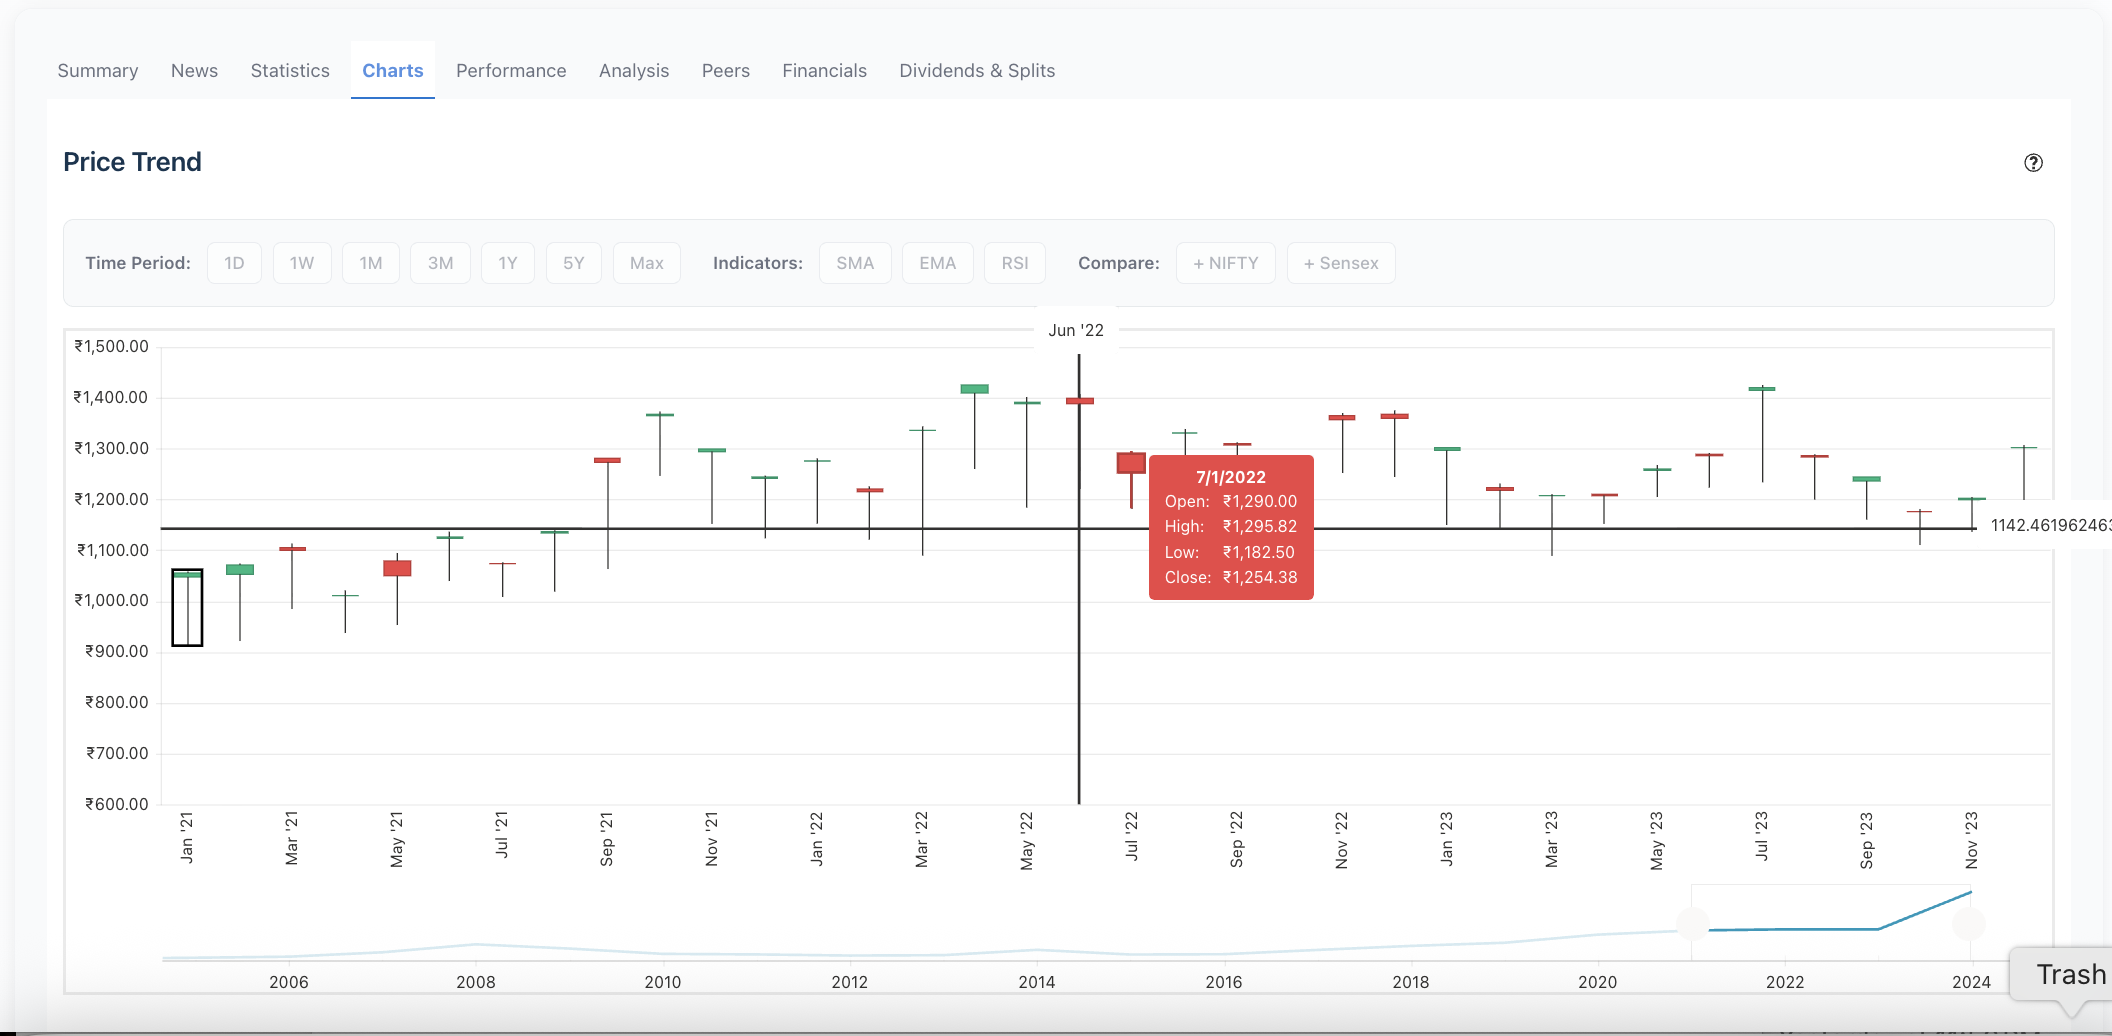
Understanding a Single Candlestick
Each candlestick represents price action for a specific time period (day, week, month, etc.) and shows four key pieces of information:
- Open Price - The price at the start of the period
- High Price - The highest price during the period
- Low Price - The lowest price during the period
- Close Price - The price at the end of the period
Candlestick Components
- Body - The rectangular part showing the range between open and close
- Wick/Shadow - The thin lines above and below the body showing high and low
- Color - Typically green (or white) for price increase, red (or black) for price decrease
Basic Candlestick Patterns
Bullish Patterns (Potential Price Increase)
- Green/White Candles - Close higher than open, indicating buying pressure
- Long Lower Wick - Sellers pushed price down, but buyers brought it back up
- Small Body with Long Wicks - Indecision, potential reversal
Bearish Patterns (Potential Price Decrease)
- Red/Black Candles - Close lower than open, indicating selling pressure
- Long Upper Wick - Buyers pushed price up, but sellers brought it back down
- Large Red Body - Strong selling pressure
Common Candlestick Patterns
1. Doji
A candlestick where open and close are nearly the same, creating a small body. Indicates indecision and potential reversal.
2. Hammer
A small body at the top with a long lower wick. Often signals a potential bullish reversal after a downtrend.
3. Shooting Star
A small body at the bottom with a long upper wick. Often signals a potential bearish reversal after an uptrend.
4. Engulfing Patterns
When one candle completely "engulfs" the previous candle's body. Bullish engulfing (green engulfs red) suggests upward momentum; bearish engulfing (red engulfs green) suggests downward momentum.
How to Use Candlestick Charts on Blanket
Step 1: Access the Chart
Navigate to any stock page and locate the price chart section.
Step 2: Select Candlestick View
If available, switch from line chart to candlestick view using the chart type selector.
Step 3: Choose Time Period
Select the time period (1D, 1W, 1M, etc.) that matches your analysis timeframe.
Step 4: Identify Patterns
Look for:
- Sequences of candlesticks forming patterns
- Changes in candle size and color
- Wick lengths indicating support or resistance
- Patterns at key price levels
Interpreting Patterns
Support and Resistance
- Support - Price level where buying interest is strong (often shown by long lower wicks)
- Resistance - Price level where selling interest is strong (often shown by long upper wicks)
Trend Identification
- Uptrend - Series of higher highs and higher lows, mostly green candles
- Downtrend - Series of lower highs and lower lows, mostly red candles
- Sideways/Consolidation - Price moving in a range, mixed candle colors
Important Considerations
- Patterns are not guarantees - They indicate possibilities, not certainties
- Context matters - Consider overall market conditions and company fundamentals
- Volume confirmation - Patterns are stronger when accompanied by high trading volume
- Timeframe matters - Patterns on longer timeframes are generally more reliable
- Combine with other analysis - Use candlestick patterns along with fundamental analysis and Blanket Pulse Rating
Best Practices
- Start by understanding basic candlestick components
- Practice identifying patterns on historical charts
- Don't rely solely on patterns - use them as one tool
- Consider the overall trend, not just individual candles
- Use patterns to confirm other signals, not as standalone indicators