

How to Use Economy Charts
Understanding Economy Charts
Blanket's Economy section provides comprehensive charts and data for key economic indicators that impact the Indian market. Understanding these metrics helps you make informed investment decisions by considering the broader economic context.
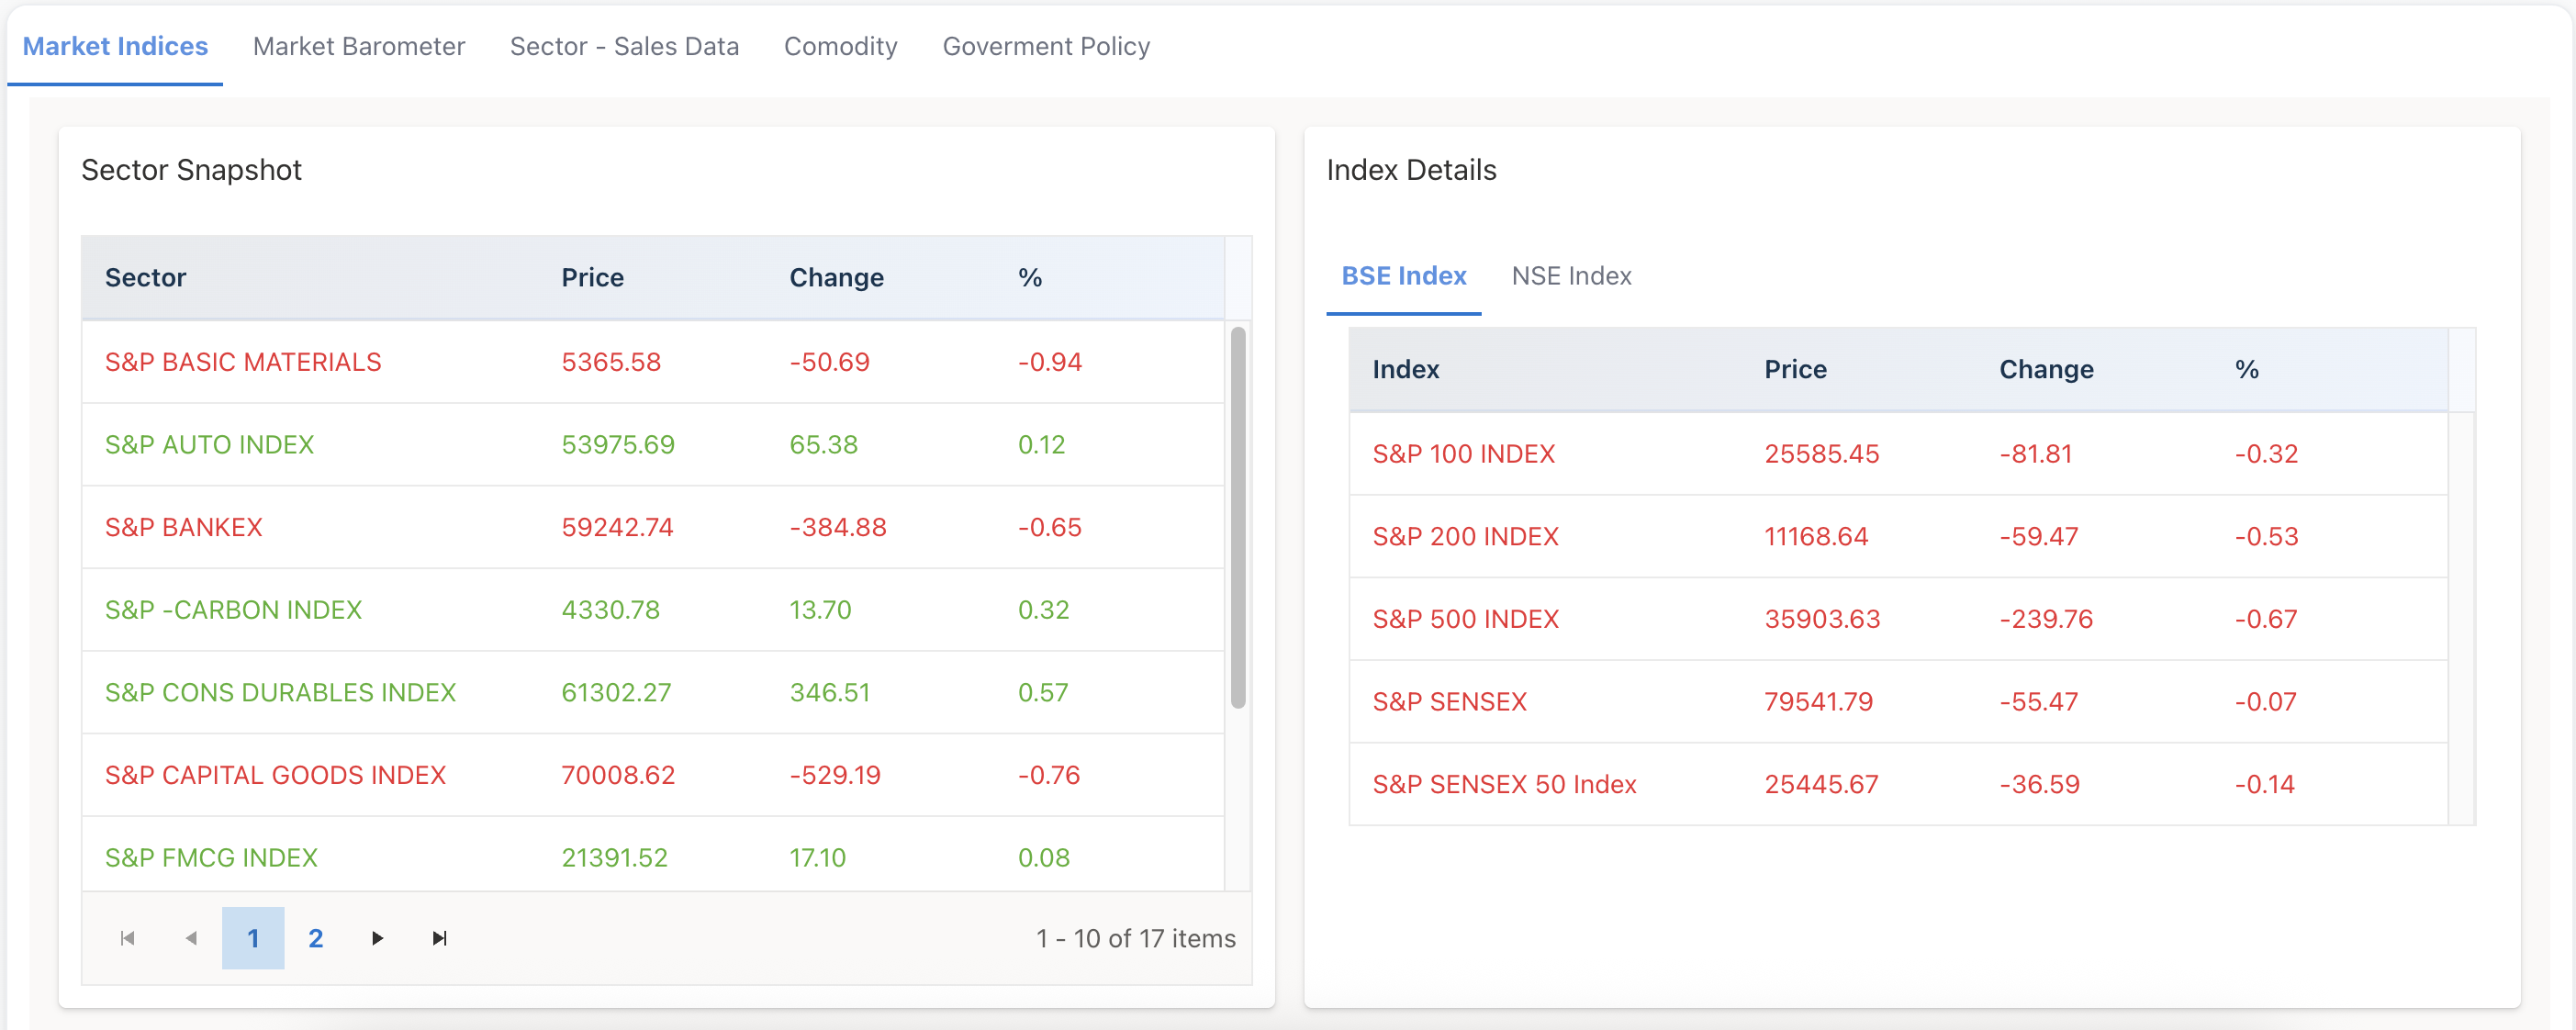
This capture is Blanket's live Economy dashboard with Market Pulse tiles, so readers can map each indicator in the narration to the exact widgets they will click.
Key Economic Indicators
1. GDP (Gross Domestic Product)
GDP measures the total value of goods and services produced in India. It's a key indicator of economic health.
- What to Look For: Growth trends, quarterly changes, year-over-year comparisons
- Why It Matters: Strong GDP growth typically supports stock market performance
- How to Read: Upward trends indicate economic expansion; downward trends suggest contraction
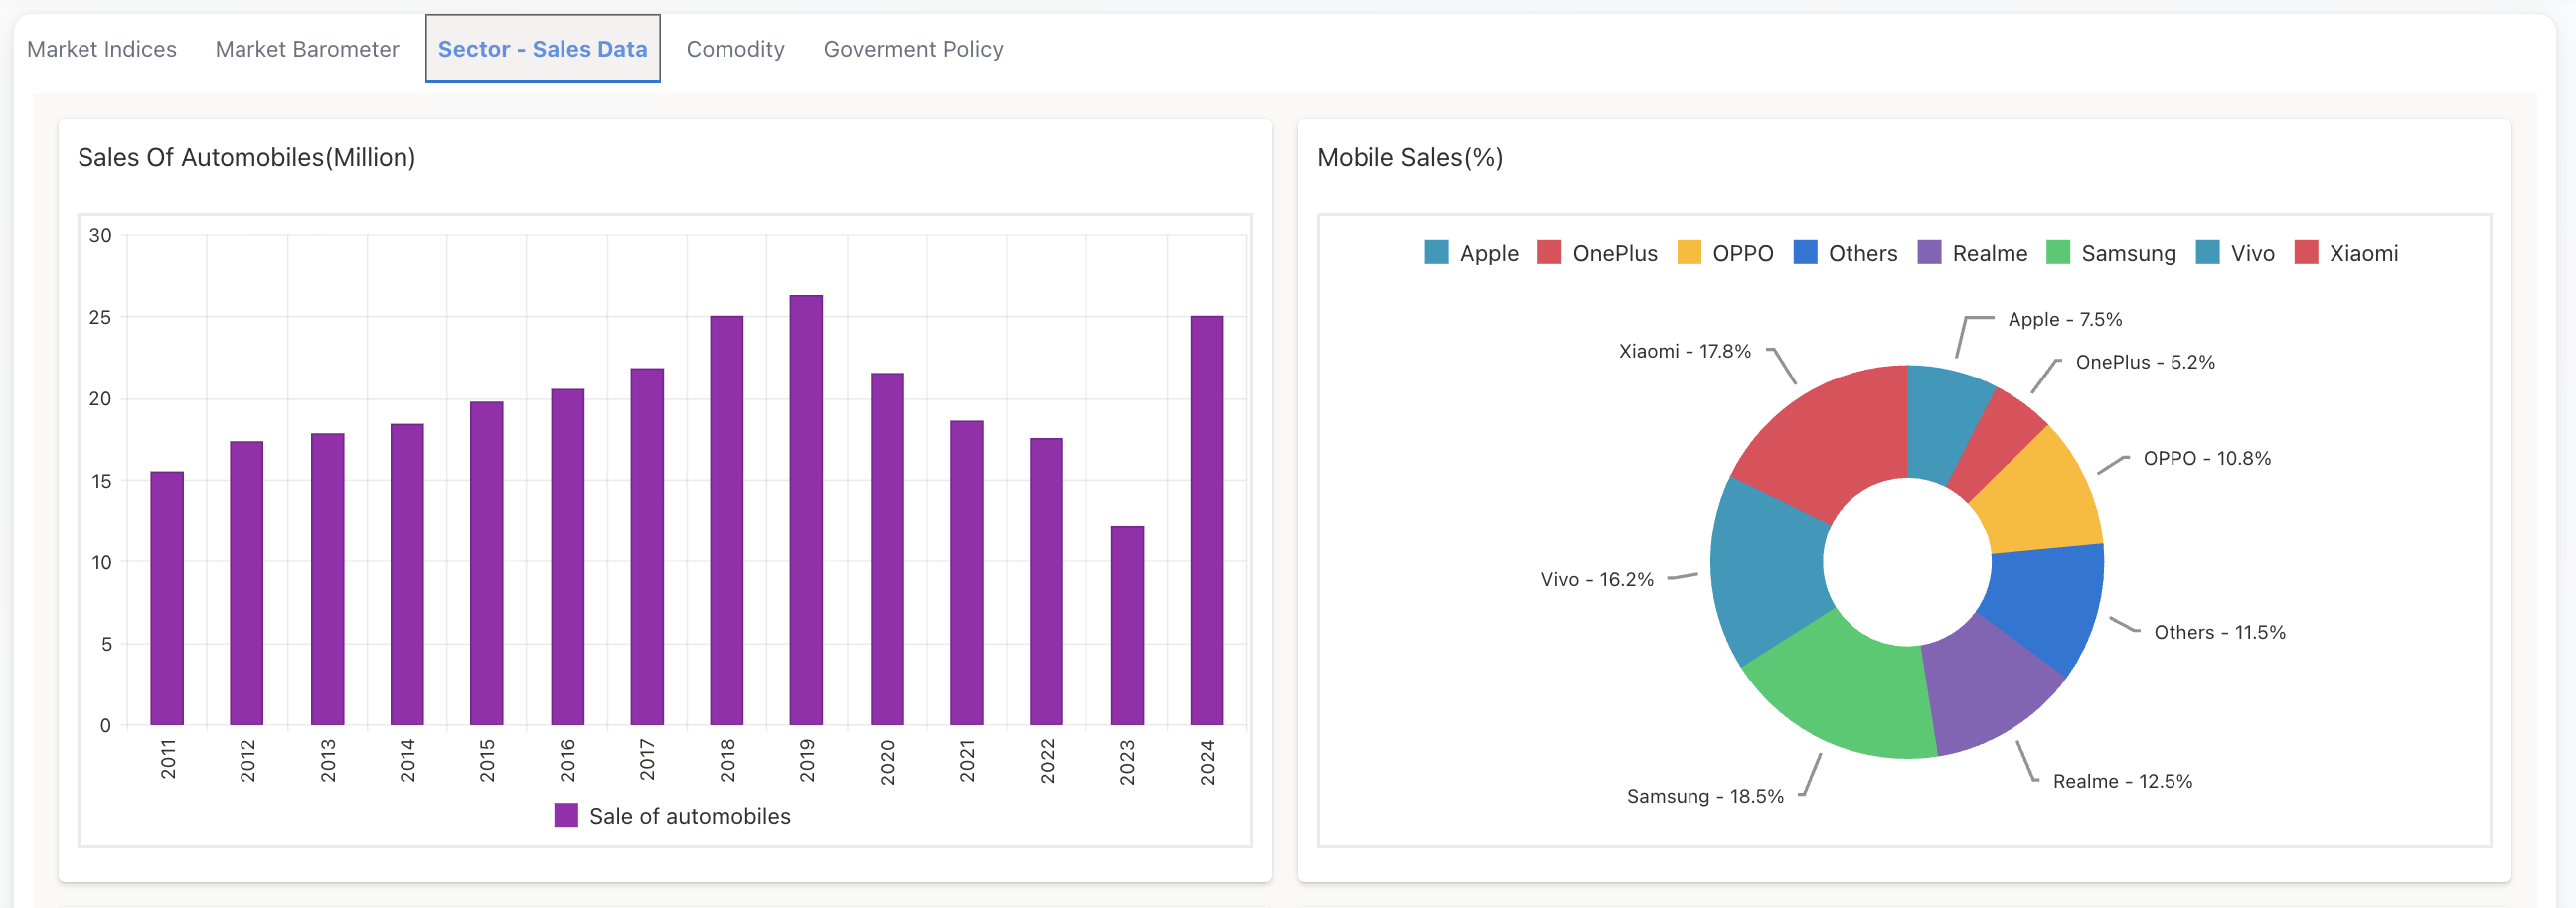
The line chart above is the same multi-indicator widget inside Blanket; use the tabs on top to flip between GDP, Inflation, GST, or any other macro data without leaving the page.
2. GST (Goods and Services Tax) Collection
GST collection data reflects consumption and economic activity levels.
- What to Look For: Monthly collection trends, seasonal patterns
- Why It Matters: Higher GST collections indicate stronger economic activity
- How to Read: Consistent growth suggests healthy consumption patterns
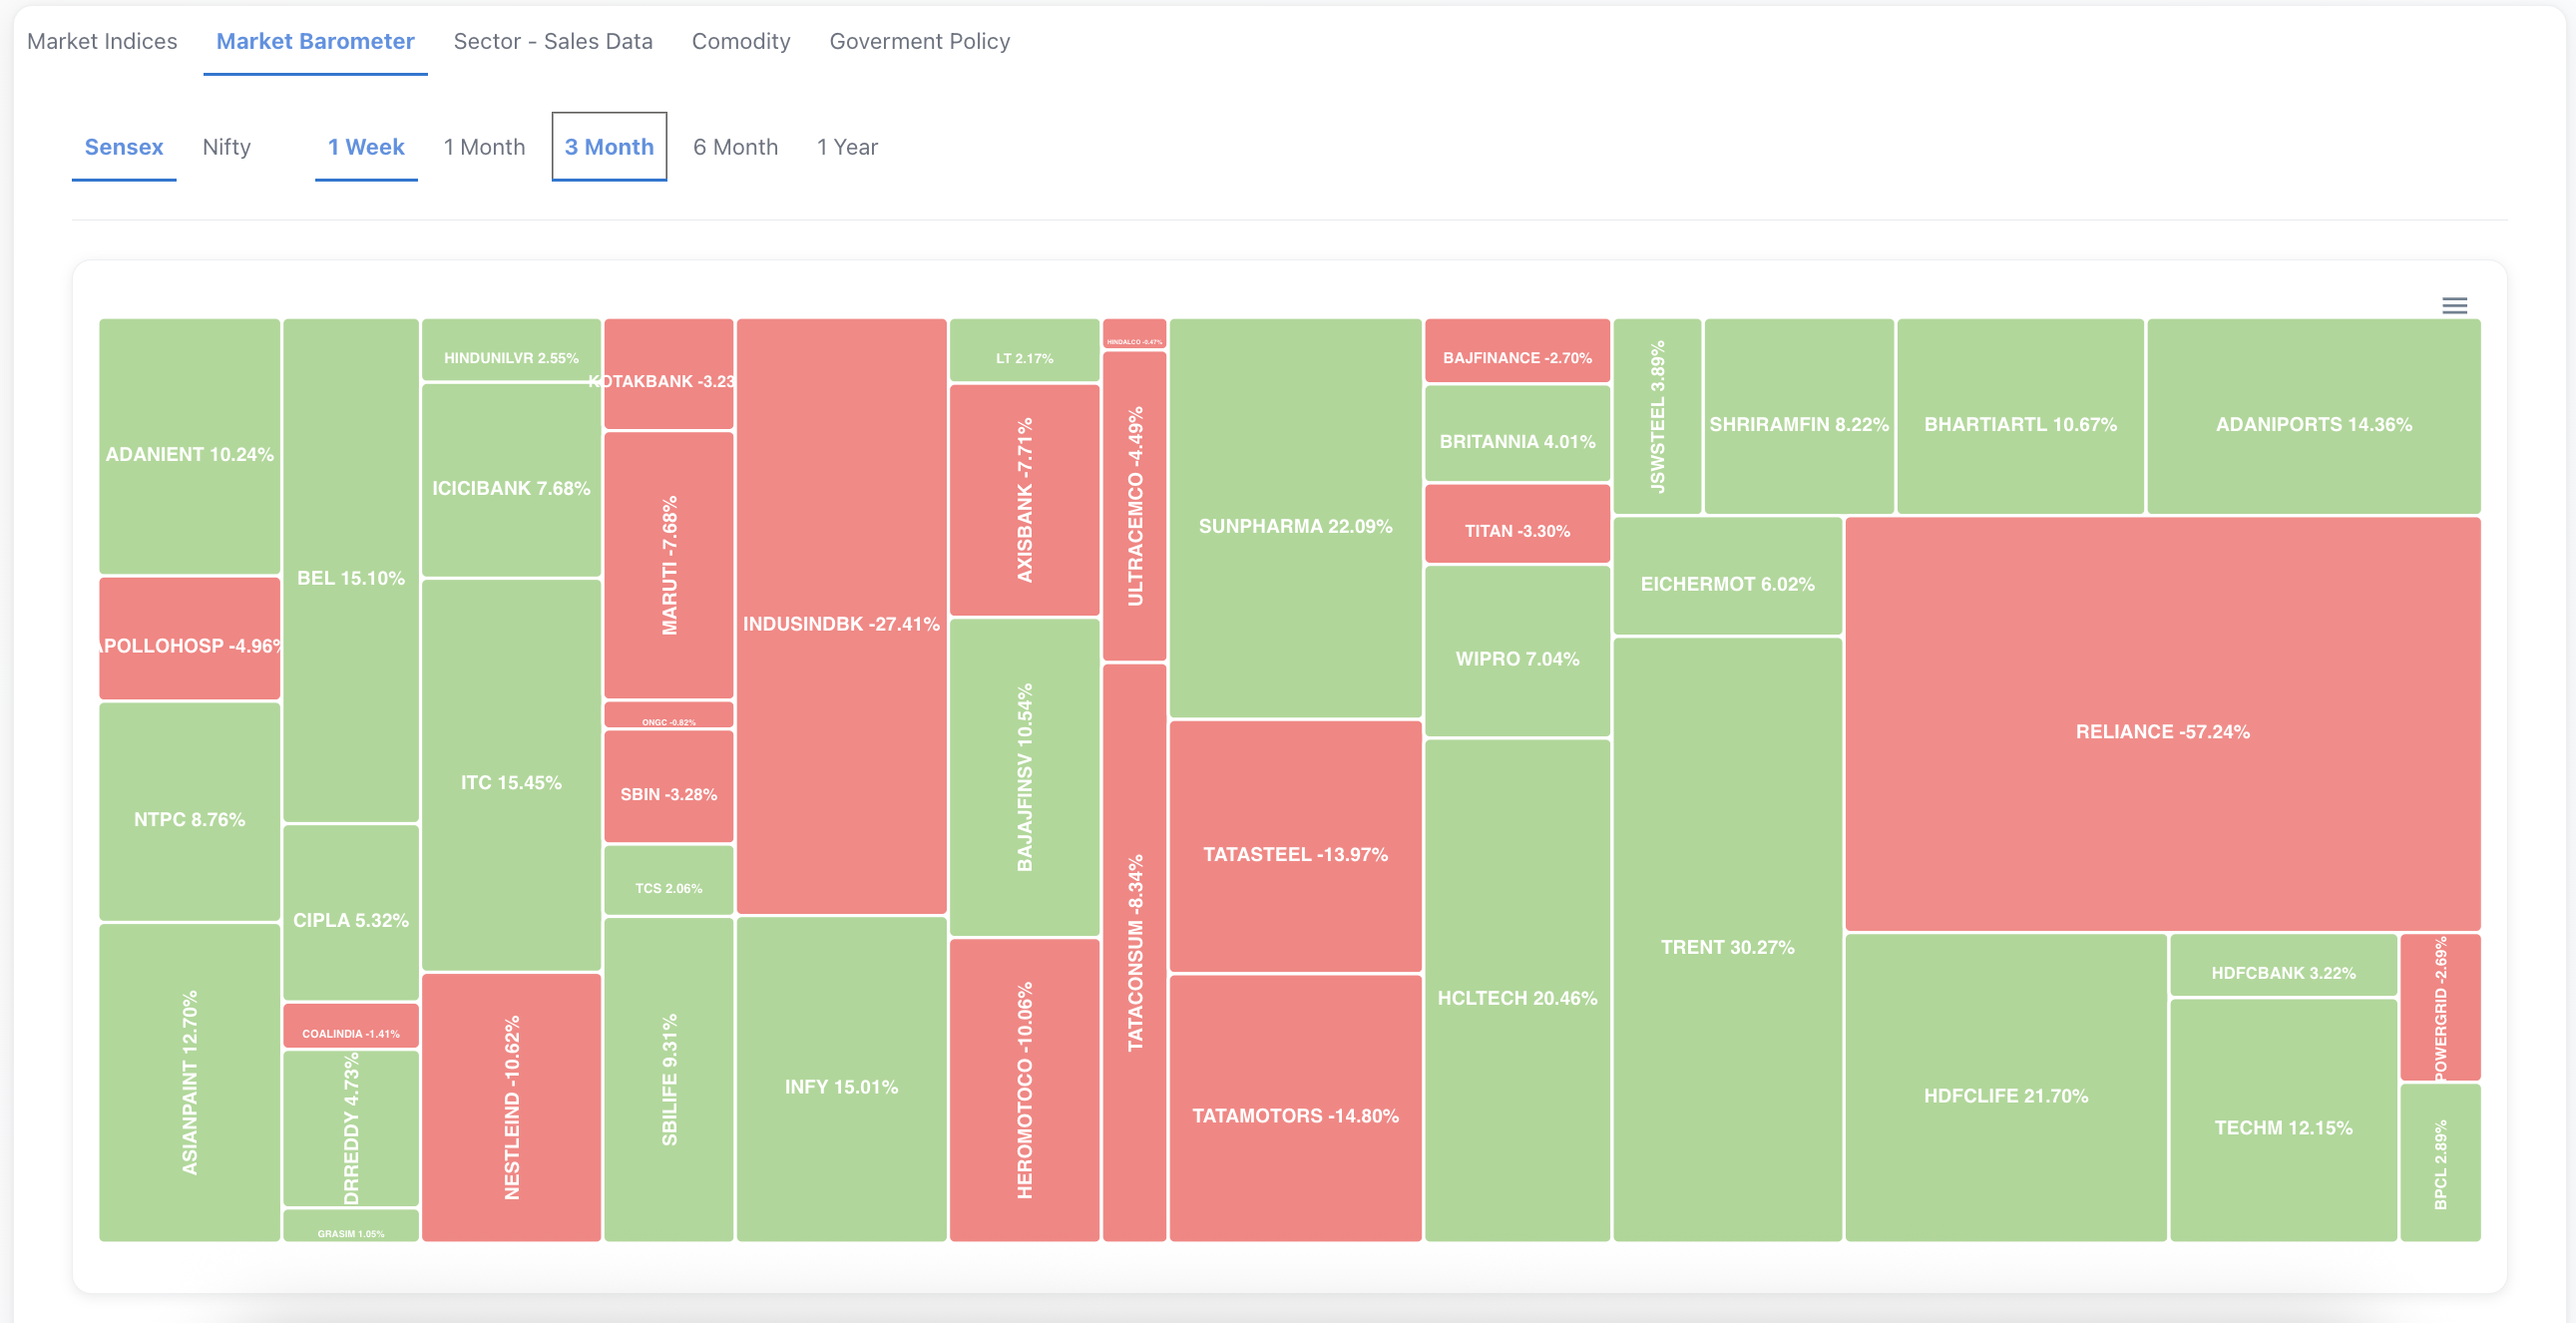
Blanket overlays GST collections with the Sensex/Nifty barometer (shown here) so you can relate tax receipts to market breadth instantly.
3. Inflation (CPI - Consumer Price Index)
Inflation measures the rate at which prices of goods and services rise.
- What to Look For: Monthly inflation rates, trends over time
- Why It Matters: High inflation erodes purchasing power and affects interest rates
- How to Read: RBI targets 2-6% inflation; sustained high inflation is concerning
Because the same chart component supports multiple overlays, the screenshot doubles as the inflation tracker—just tap the CPI toggle highlighted in the UI.
4. Other Indicators
Blanket also tracks:
- Interest Rates - RBI policy rates affecting borrowing costs
- Unemployment Rate - Labor market health
- Trade Balance - Exports vs imports
- Foreign Exchange Reserves - Economic stability indicator
How to Use Economy Charts
Step 1: Navigate to Economy Section
Click on "Economy" in the main navigation menu.
Step 2: Select the Indicator
Use tabs or dropdown to select the economic indicator you want to view.
Step 3: Adjust Time Period
Most charts allow you to view data over different time periods:
- 1 Week
- 1 Month
- 3 Months
- 6 Months
- 1 Year
- Longer periods
Notice the preset chips at the top of the chart—those are the same 1W/1M/3M/6M/1Y buttons you will click on Blanket to change the time horizon.
Step 4: Analyze Trends
Look for:
- Trends - Is the indicator improving or declining?
- Volatility - How stable or erratic are the changes?
- Patterns - Are there seasonal or cyclical patterns?
- Correlations - How do different indicators relate to each other?
Interpreting the Data
For Stock Investors
- Strong GDP Growth → Generally positive for stocks
- Rising Inflation → May lead to higher interest rates, affecting stock valuations
- High GST Collections → Suggests strong consumption, good for consumer stocks
For Portfolio Planning
- Use economic data to understand market context
- Adjust portfolio allocation based on economic cycles
- Consider economic indicators when timing investments
The multi-panel layout in the screenshot mirrors Blanket's comparison grid, letting you pin GDP, GST, inflation, and currency charts side-by-side exactly as described.
Market Barometer
The Economy section also includes the Market Barometer, which tracks:
- Sensex Performance - BSE Sensex index trends
- Nifty 50 Performance - NSE Nifty index trends
These provide a quick view of overall market sentiment and direction.
Best Practices
- Check economic indicators regularly to stay informed
- Don't react to single data points - look for trends
- Understand the context - what's normal for the Indian economy?
- Use economic data as one input in your investment decisions
- Consider how economic trends might affect different sectors differently