

How to Use the Stock Page
Navigating the Stock Page
Blanket's Stock Page provides comprehensive analysis and insights for any stock listed on Indian exchanges. This guide will help you understand and use all the features available on this powerful page.
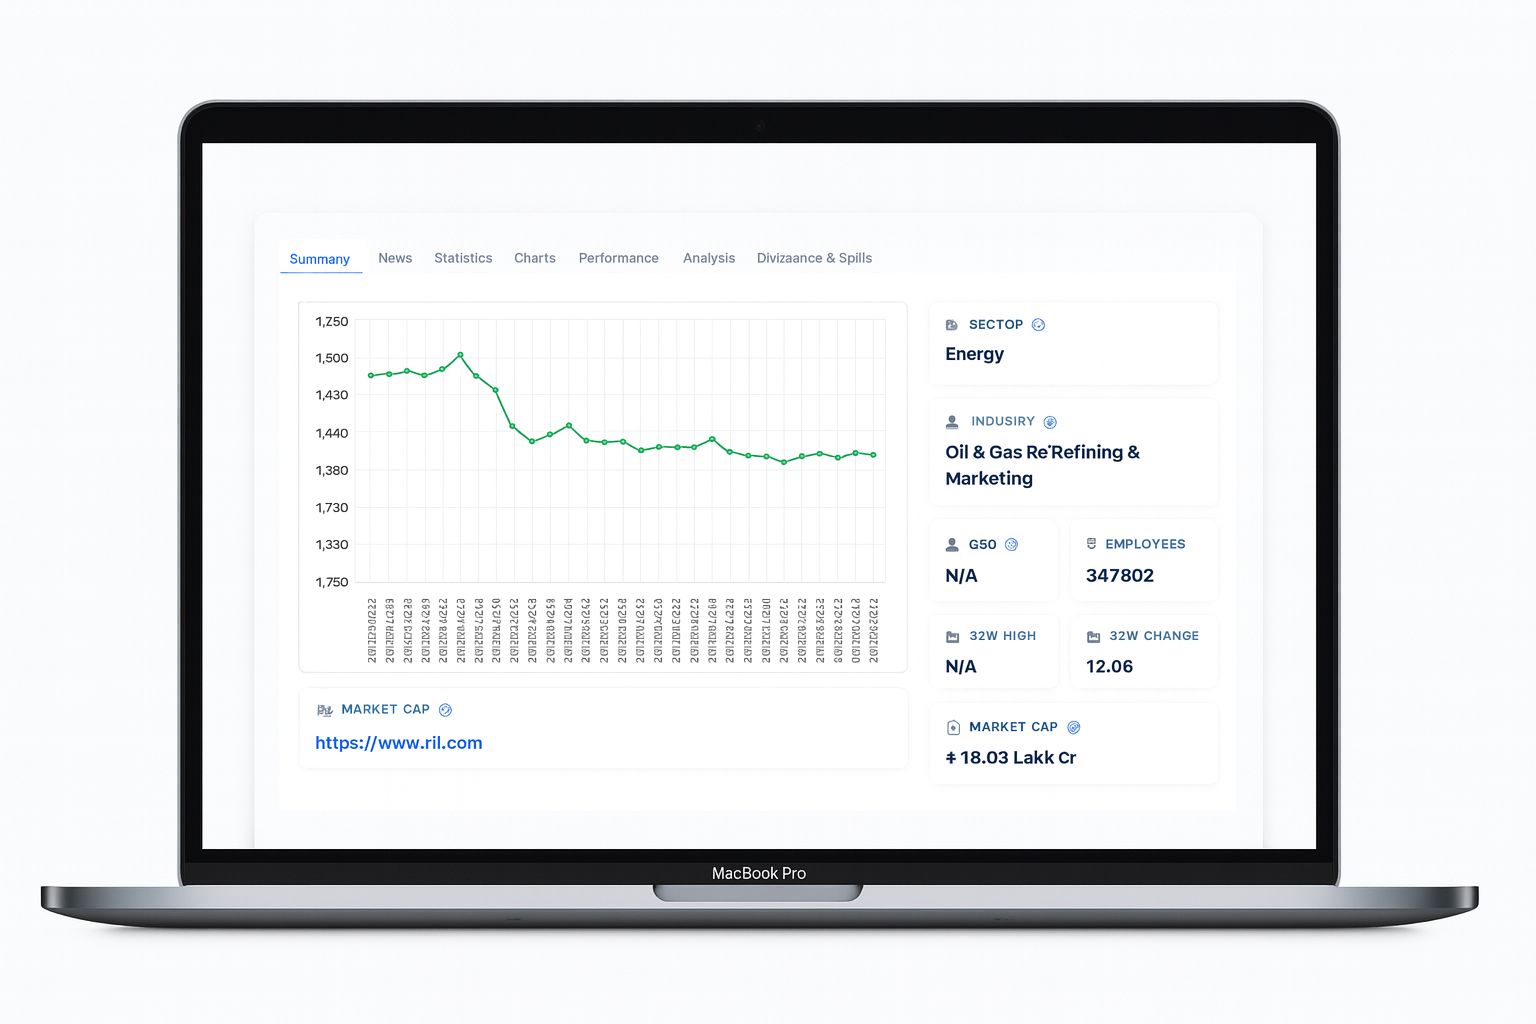
Key Sections
1. Stock Header
At the top of the page, you'll find:
- Company Name & Symbol - The stock's trading symbol and full company name
- Current Price - Real-time or latest available stock price
- Price Change - Daily change in price and percentage
- Blanket Pulse Rating - The 5-Chakra rating system display

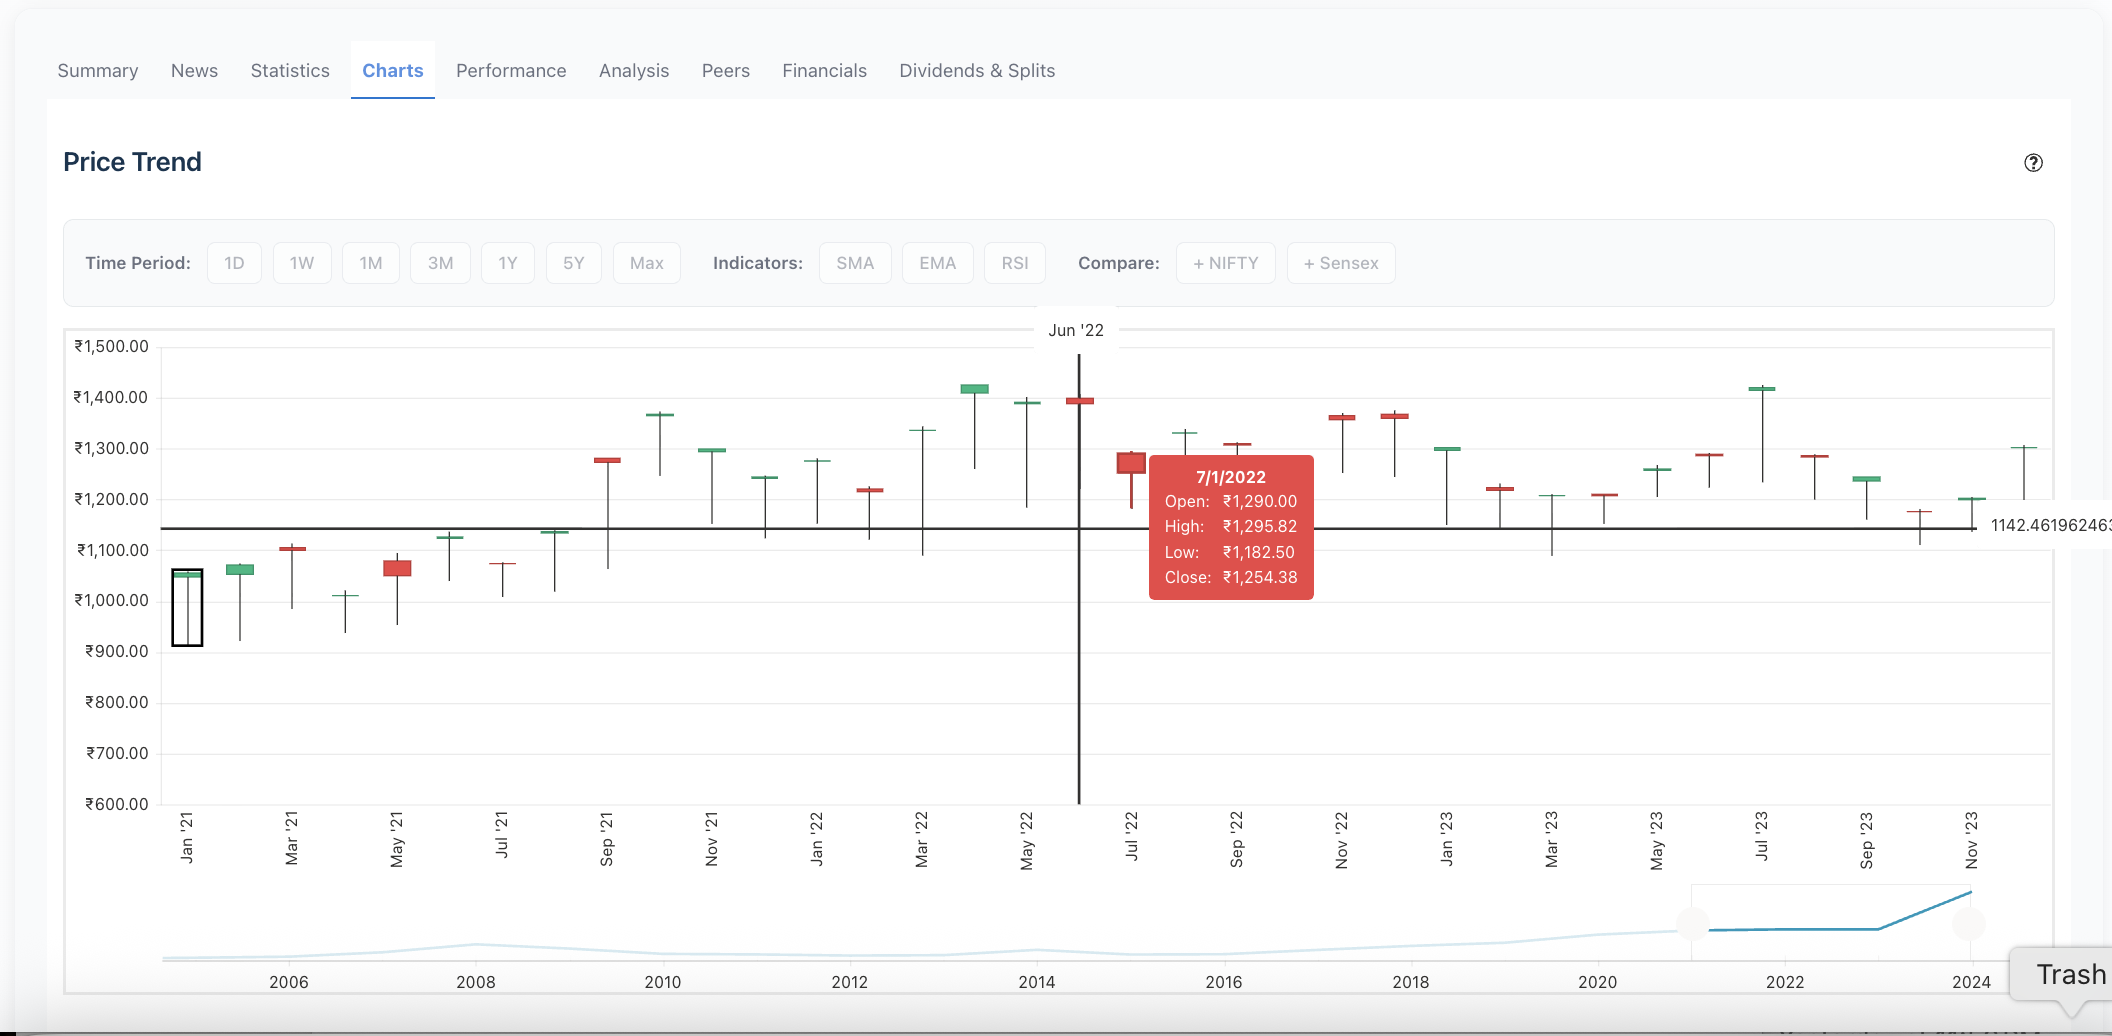
2. Stock Charts
The charts section includes:
- Price Chart - Historical price movements over different time periods
- Candlestick Chart - Detailed price action with open, high, low, close data
- Volume Chart - Trading volume analysis
- Time Period Selector - Switch between 1D, 1W, 1M, 3M, 6M, 1Y views
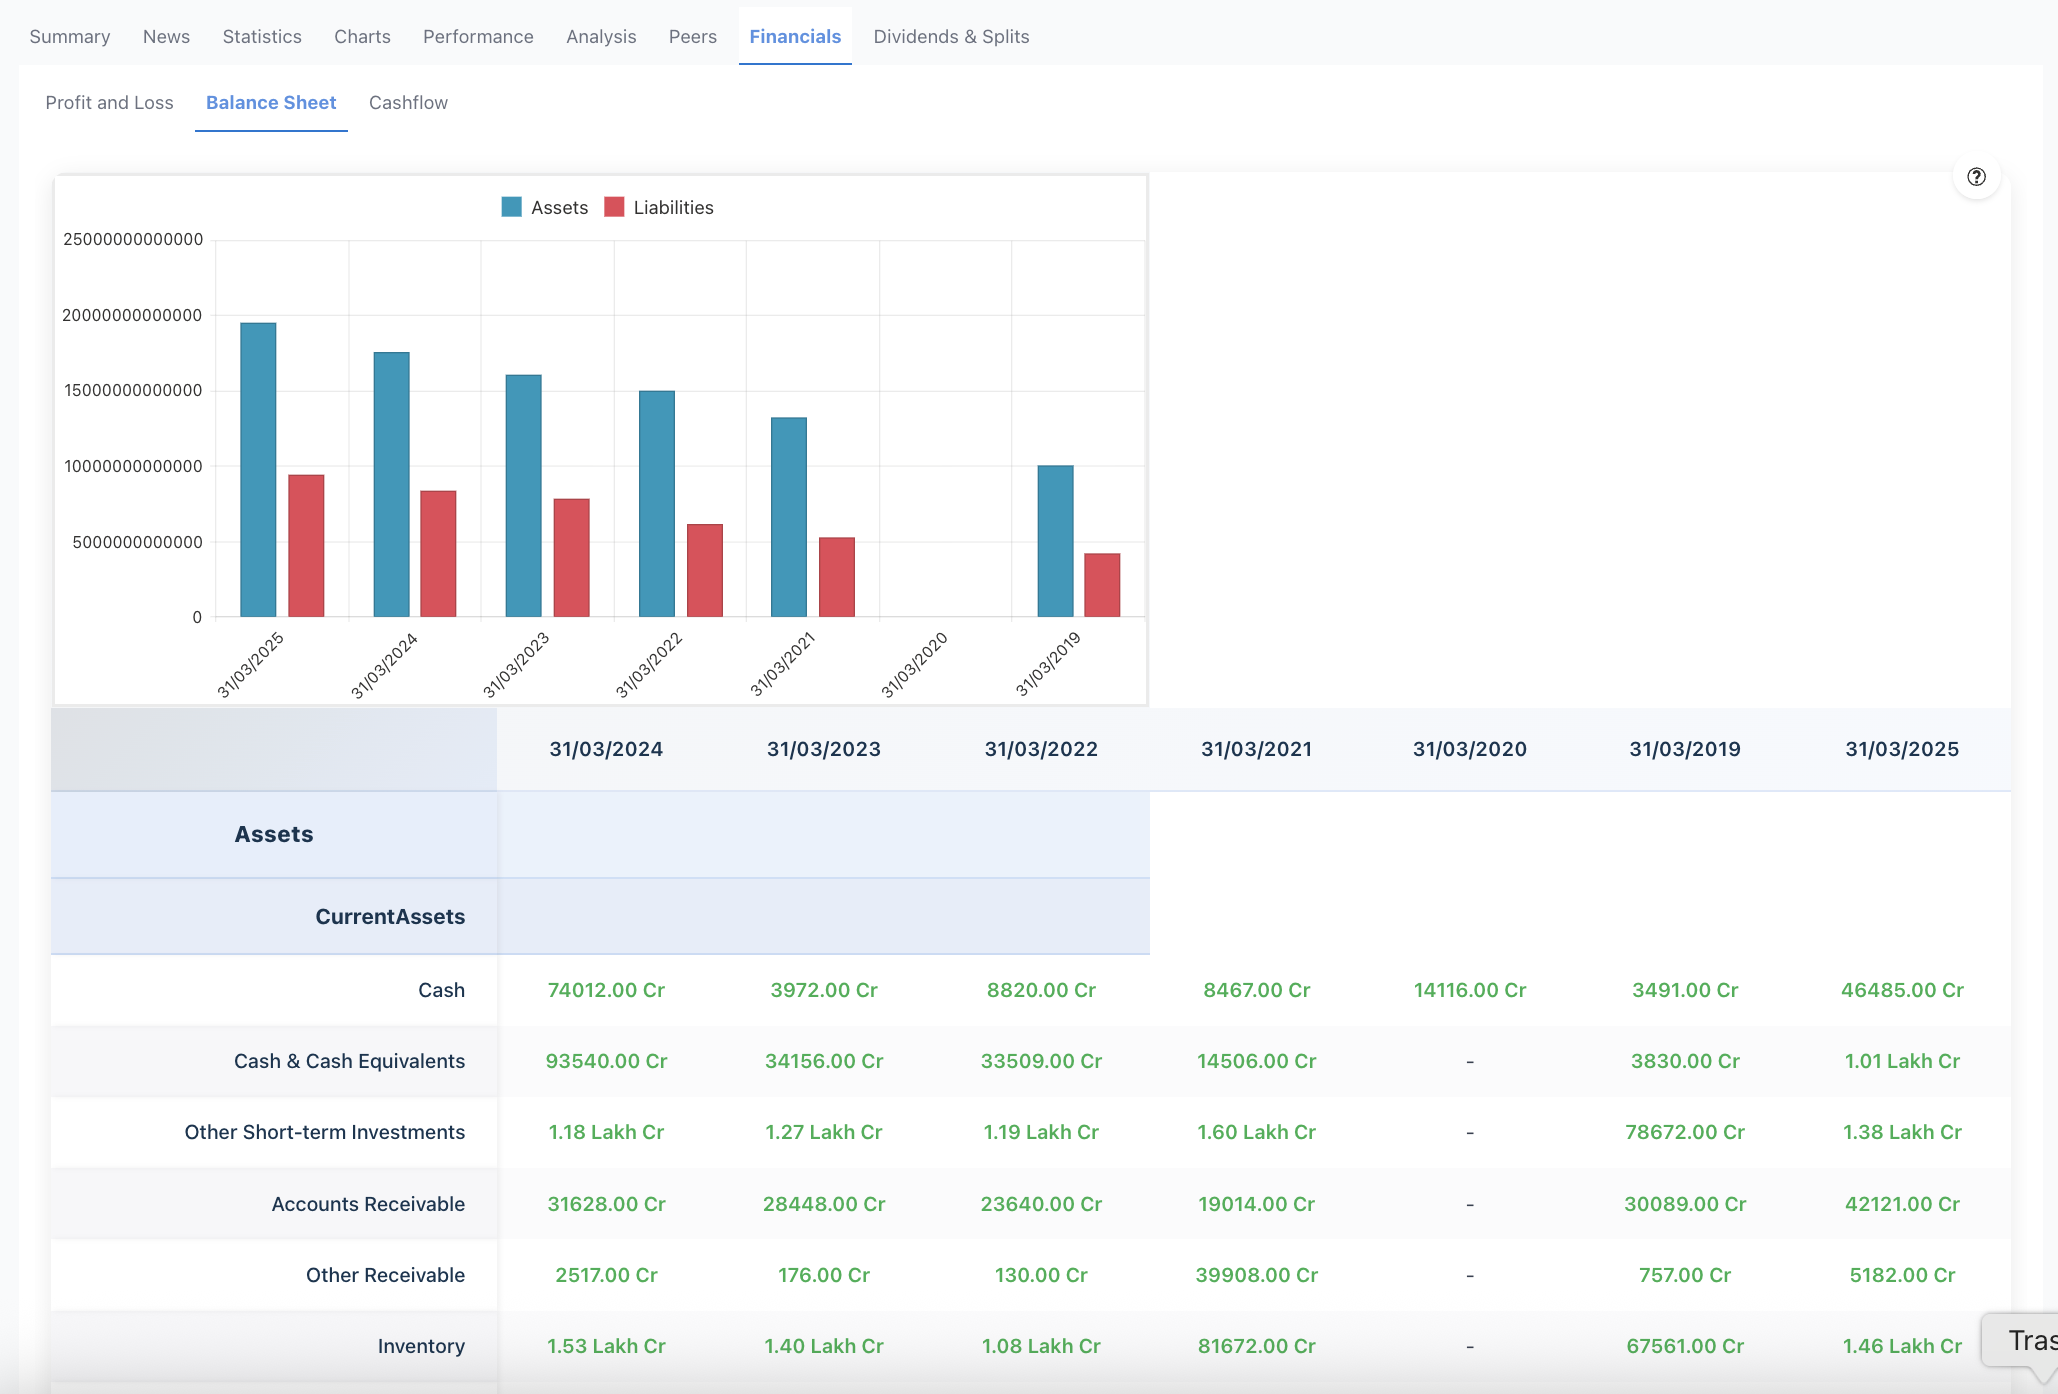
3. Financial Analysis
This section provides:
- Valuation Metrics - P/E ratio, P/B ratio, and other key ratios
- Financial Statements - Income statement, balance sheet, cash flow
- Key Ratios - Profitability, efficiency, and liquidity ratios
- Fair Value Estimate - Blanket's calculated fair value
4. Company Information
Learn about the company:
- Company Profile - Business description and industry
- Key Metrics - Market cap, shares outstanding, etc.
- Sector & Industry - Classification and peers
5. Risk Assessment
Understand the risks:
- Risk-O-Meter - Visual risk level indicator
- Risk Score - Detailed risk analysis
- Volatility Metrics - Historical volatility data
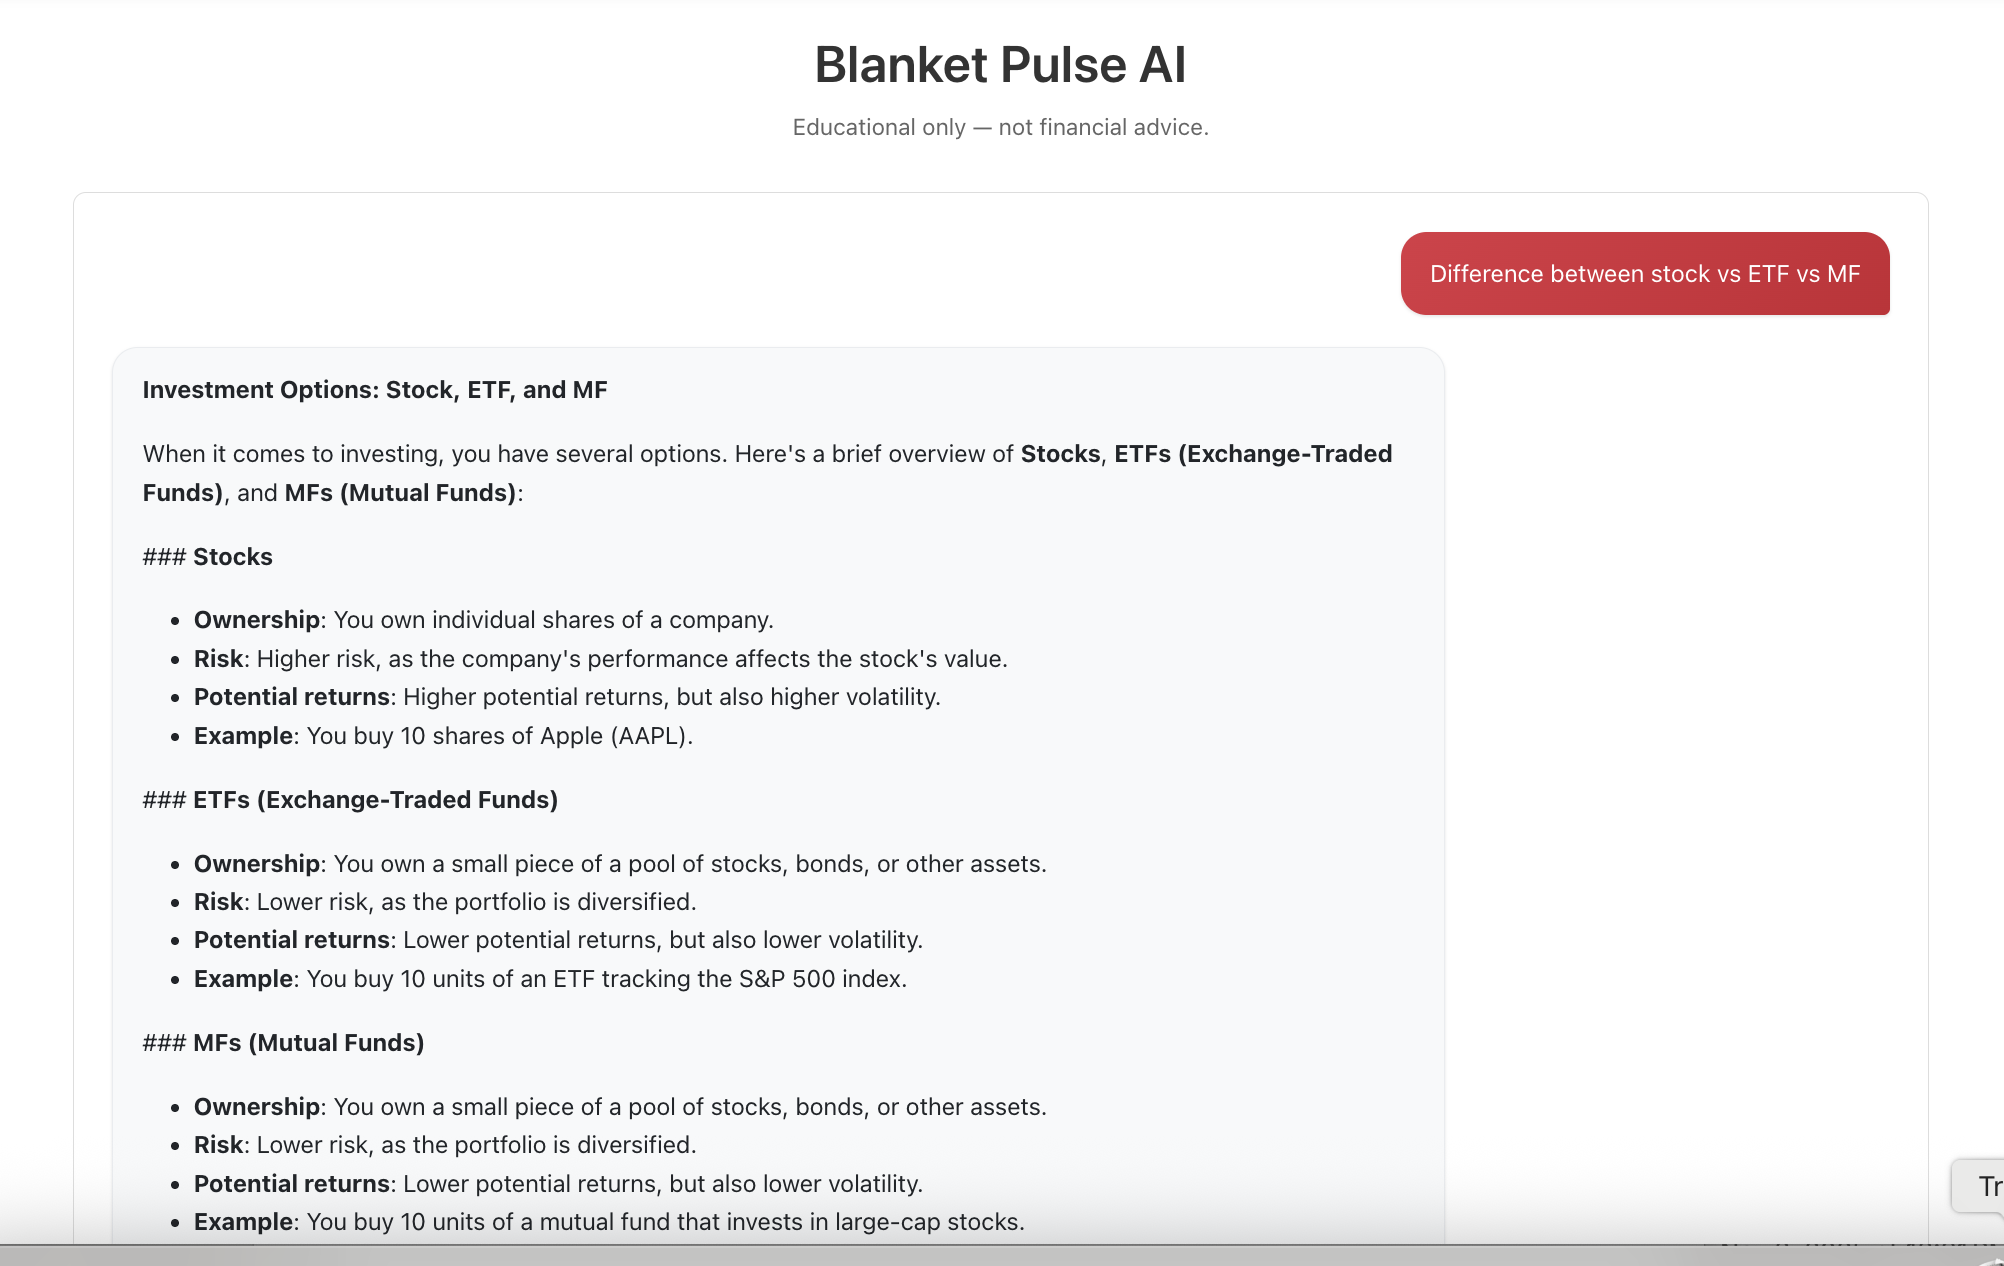
How to Use the Stock Page
Step 1: Search for a Stock
Use the search bar at the top of the page to find any stock by name or symbol.
Step 2: Review the Rating
Check the Blanket Pulse Rating (Chakra display) to quickly assess investment quality.
Step 3: Analyze the Charts
Review price trends and patterns using different time periods to understand historical performance.
Step 4: Examine Financials
Dive into financial statements and ratios to understand the company's financial health.
Step 5: Assess Risk
Check the Risk-O-Meter and risk metrics to ensure the stock aligns with your risk tolerance.
Pro Tips
- Compare stocks by opening multiple tabs
- Use the time period selector to analyze short-term vs long-term trends
- Pay attention to both the Pulse Rating and Risk-O-Meter together
- Review financial statements over multiple periods to spot trends